Navigation auf uzh.ch
Navigation auf uzh.ch
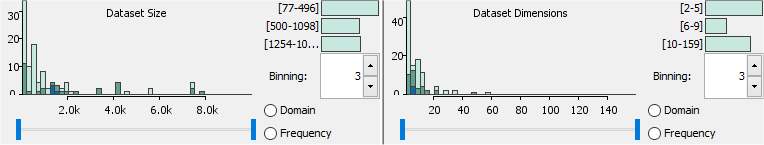
With the era of data-centered research and decision making, the number of (available) datasets has grown to numbers that have never been seen before. Large web platforms have emerged which aim at sharing large collections of datasets to make them available for the public. On top of individual platforms, research approaches like VizNet summarize and combine collections of dataset collections to further ease datasets access, comparison, and experiment replication. Overall, VizNet orchestrates the strong number of 31 millions of datasets.
Analysis Questions
This master thesis builds upon these newly existing sources of datasets. The thesis goal is to address central questions existing in many data science approaches given the wealth of available datasets:
Approach
Interactive Visual Data Analysis (IVDA) is a promising approach to help answering these questions. The benefit of IVDA tools is the ability to combine the strengths of both humans and machines in a unified data analysis workflow. Along these lines, the approach in this thesis will combine automatic analyses with interactive visual user interfaces. As a result, the IVDA tool will also be applicable for user groups without expertise in programming and data science. To achieve this, the IVDA tool will utilize concepts and practices from the Information Visualization and Visual Analytics research fields.
The goal of this thesis is to design, implement, and validate a IVDA tool to support users in answering the previously described types of analysis questions. Starting from a huge collection of datasets, a first milestone will be to access and preprocess these datasets, as well as to extract features using the VizNet approach on GitHub. Building upon this, a data science workflow will be designed in an iterative way, including machine learning models as well as interactive visual interfaces. A validation process needs to be conducted to ensure that the IVDA tool helps to answer important analysis questions. More formally, the very basic workflow should include following aspects:
With this workflow at hand, dedicated solutions can be designed that help answering the analysis questions presented earlier.
The driving application example will be on the separability of classes in labeled datasets to conduct classification tasks. More information about the assessment of class separation can be found here
|
Prof. Dr. Jürgen Bernard The applications should be sent to bernard@ifi.uzh.ch. For questions, feel free to contact Prof. Bernard using this Email as well. |
|
